Eco Spring
Product Design
My role: Product Design, User Researcher
Eco-Spring is an interactive water refill station: raising awareness of real-time water quality within campus communities

Project Overview
Assigned by Blue CoLab, the design challenge involves creating a user experience to enhance awareness and accessibility of real-time water quality information across a university campus.
This initiative is led by a group of students and faculty at Pace University who actively monitor Choate Pond on their campus. The goal is to gain a deeper understanding of the impacts on water quality stemming from both human and natural activities.
My role: Product Design, User Researcher


Problem Space

U.S. residents are getting sick and dying from contaminated water.
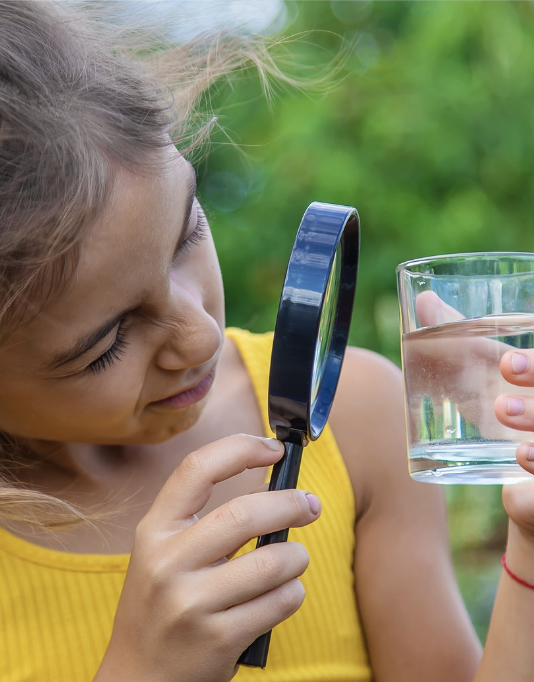
Knowing more about our water can encourage us to ensure that it’s safe.
General Research
Literature & Competitive Review
The findings indicate a gap between obtaining real-time water quality data and effectively conveying this information to individuals. Bridging this gap of opportunity enhances transparency and encourages a more informed and engaged approach to understanding water quality information.
Open Research Questions
How much information
do users care to know about water quality?
★ Findings ★
Current systems are not for the general public
Reliant on outside factors
User Interviews & Surveys
Varying level of interest
Our primary objective is to comprehensively uncover the needs, motivations, behaviors, and experiences of both students and university staff about the utilization of public water fountains and refilling stations across Pace University’s New York City campus.
The overarching aim of our investigation is to discern effective strategies for raising awareness regarding water quality data on our campus and to explore optimal methods of presenting and accessing this information in a user-friendly manner.
Objectives
To discover user behaviors and experiences about using the public drinking water fountains and refilling stations at the university campus.
To gauge and understand our users’ prior knowledge and awareness about water quality.
To learn about any challenges and pain points that our users may encounter with their experiences.
To inform the research team’s vision and goals for building a platform that meets the target audience's needs.
Methods
To fulfill our research objectives, we employed the following methodologies to collect feedback and extract valuable insights for this project. These insights subsequently guided our decision-making in constructing the project, ensuring its precise alignment with the needs of our target audience.


Screener Surveys
This aimed to filter ideal participants with relevant experiences. Through these surveys, we aimed to pool ideal participants who could contribute valuable insights to our study.
User Interview
To discover and understand participants’ attitudes toward water quality, we opted for in-person user interviews. These interviews aimed to discuss and uncover perceptions and attitudes related to water quality, with a specific focus on individuals familiar with water fountains and/or refill stations. They also highlighted challenges and pain points,
Participatory Design Sessions
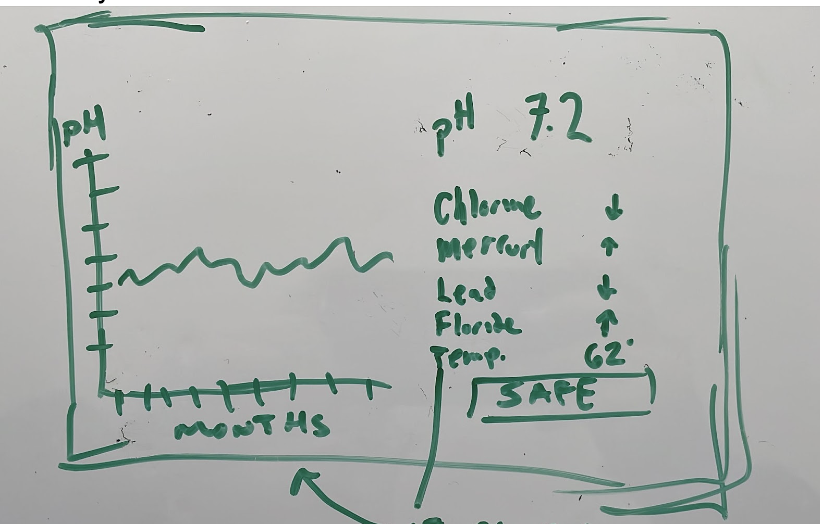
Following our interview questions, participatory design sessions were employed to directly engage with users for ideating on a solution that determines the safety of drinking water.

Thematic Analysis
To collectively gather and analyze our research findings into themes that helped us in forming valuable insights.


Water quality awareness is a shared concern among all users
Would displaying water quality at water refill stations be more effective than checking water quality on mobile devices?


★ Findings ★
Concise information is preferred
How might we design an effective water quality monitoring concept that students and non-technical users can easily use and understand?
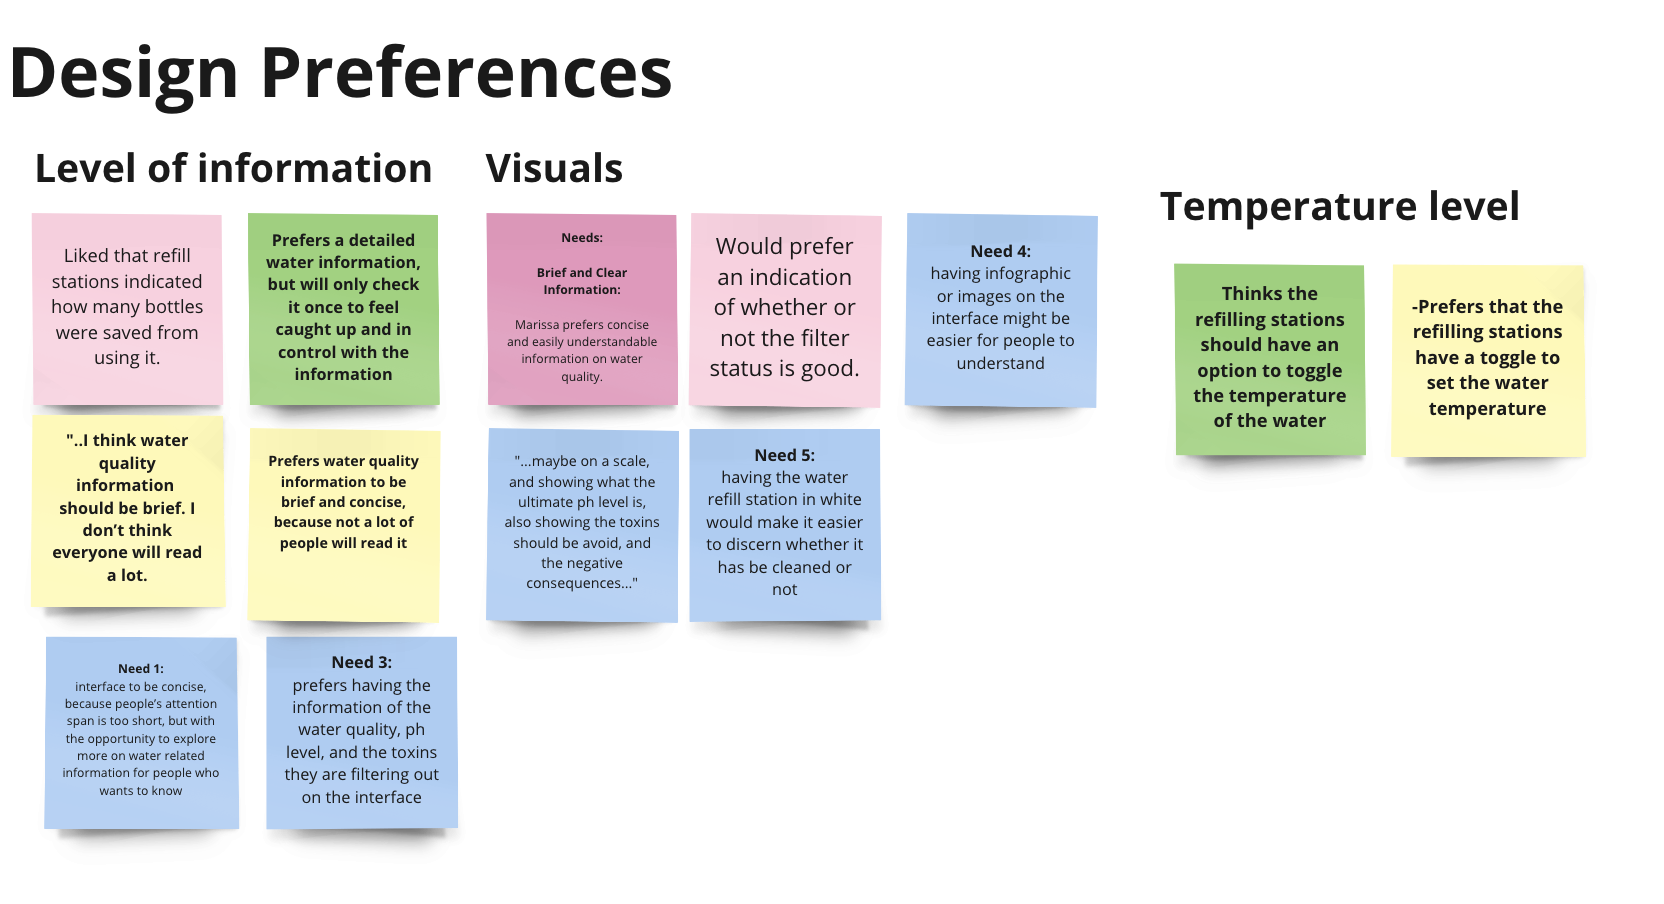

Accessible water quality information
Product Idea

A water refill station with an interactive interface.
Interface features:
WQI & pH level cards
Status of last filter changes
Refill station map
Station features:
Braille & audio accessibility
Temperature toggle
Water sensor
Usability Study
The usability study involved recruiting a group of students, who were interviewed in our previous user interview sessions, and a set of moderated usability test sessions to observe them as they performed 3 tasks while using our prototype.
User Interview Sessions
These sessions included an assessment of the participant’s abilities to complete a set of tasks using the think-out loud method.
User Tasks
Find out water quality
Find and learn more about the water quality
Find another refill station on the second floor.
SUS Questionnaire
Post-Study Questions
The post-study questions encouraged participants to share any additional thoughts on their experience using the interface. We were able to gain a better understanding of which tasks were easy, which tasks were difficult, and what features participants would prefer to see in future iterations.
To conclude, participants completed the SUS questionnaire. Using the results we received, we were able to calculate an average SUS score of 96.5, which indicates that our interface has excellent performance in effectiveness, efficiency, and ease of use.

★ Findings ★
Challenges in finding other water refill stations.
Difficulties in comprehending the water quality index and pH scale
More concise information regarding the water quality in the refilling station
Field Study
In our field study, the objective is to gain insights into the needs, motivations, behaviors, and experiences of students and university staff about using our product concept of a public water refilling station at Pace University's New York City campus.
The primary focus of this research is to understand our participants’ behaviors, actions, and feedback on their perceived experience with our product concept.
Objectives
To observe and understand participants’ perceived experiences, behaviors, and actions as they interact with our product concept.
To identify and establish participant profiles based on data findings and insights.
To inform the team’s design decisions to further iteration of the product’s overall design based on findings and insights.
Revised product MVP solution

Water Quality Index Indicator: Offers real-time water quality info, ratings, and additional insights for users.
Water pH Level Indicator: Communicates water pH for accessibility and awareness in refilling stations.
Low Engagement with QR Code
Water Refill Station Features
Braille and Audio Accessibility: Enhances the facility for people with visual impairments independent use, ensuring equal opportunities for all.
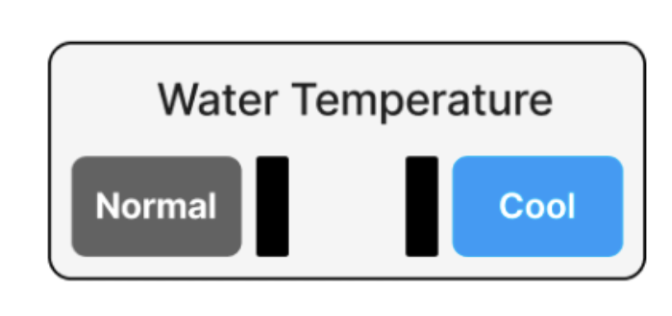
TemperatureToggle: Allows users to personalize their water experience for a more enjoyable refill process.
Water Sensor: Facilitates efficient resources by automating water flow, preventing waste, and promoting sustainability for efficiency.
Interface Features

Methods
Water Temperature Option Adds Value
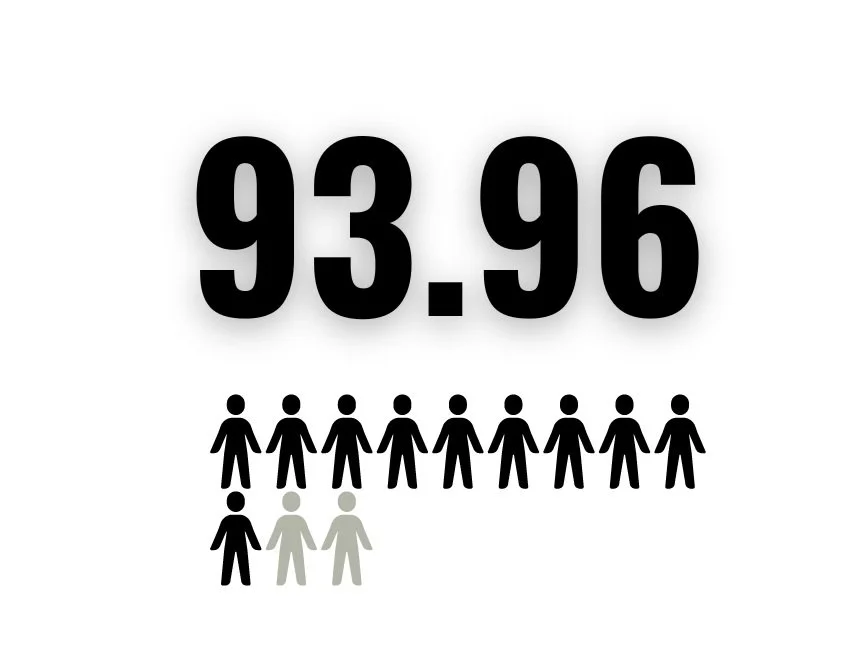
SUS Scores:
The prototype received an average score of 93.96, indicating a positive assessment of our project.
Scannable QR Code: Allows users to scan QR code on mobile for detailed water quality.
Filter Status: A real-time indicator displays the last water filter change date for the refill station.
Water Refill Station Map: Enables users to locate other on-campus water refilling stations easily.
In our pursuit of comprehensive insights, we employed a blend of qualitative and quantitative methods to delve into user experiences with our prototype. The qualitative methods provided a nuanced understanding, while the quantitative approaches allowed for measurable and structured insights.
Qualitative Methods:
Contextual Inquiry: We conducted on-site interviews with a small group of university students and staff to observe their interactions with our prototype.
Semi-structured Interview Sessions: To understand why participants acted as they did with our prototype, we asked them about their experience. Our interview setup included a facilitator, note-taker, and observer.
Quantitative Methods
Time Tracking: We recorded the duration of our participants’ performance for each task.
SUS Questionnaire: We shared a brief survey using the SUS format with participants to assess their perceived experience with the prototype's interface design.
Synthesis and Analysis
Thematic Analysis: We analyzed our data using thematic analysis to identify recurring themes, notable findings, and participant behaviors.
Spatial Analysis: Aligned with our thematic analysis, we performed spatial analysis to evaluate how participants interacted in the physical environment. This included considering ergonomic factors, prototype placement, and overall experience in the spatial context.

★ Findings ★
Positive Feedback on Interface Design
Improved Accessibility with Braille
Final Product
Eco Spring
An Interactive Water Refill Station: Raising Awareness of Real-Time Water Quality Within Campus Communities
Action
Sensor
Design
Temperature Toggle
Sustainability Awareness
Braille & Audio Accessibility

Interface Walkthrough

Next Steps

Bubbler Option

Wheelchair Accessibility
Accurate Map